Towards soarV2
The association Club Soaringmeteo intends to eventually replace soarWRF and soarGFS with soarV2. We would like to invite you to use soarV2 instead of soarWRF and soarGFS and let us know any concerns you may have. This page explains the motivation behind this decision, and describes the differences between these tools. A more detailed documentation of soarV2 is available online by clicking to the “?” at the bottom right of the page soarV2, and a PDF documentation is available here.
Why replace soarGFS?
soarWRF and soarGFS are useful to tens of thousands of soaring pilots. Why do we want to change something that works?
As it is explained in the page Support Soaringmeteo, these tools are the creation of the passionate, self-taught pilot Jean Oberson. Although they were developed more than 10 years ago, they are still very useful to soaring pilots, and the number of users is still growing. This is impressive, congratulations to Jean Oberson!
The team of Soaringmeteo volunteers would like to improve further the tools soarGFS and soarWRF: decrease the CPU usage, simplify the user experience, expand the areas covered by the forecasts, reduce the maintenance costs, etc. Unfortunately, maintaining and evolving the software written 10 years ago is hard. Therefore, we decided to rewrite it from scratch. This will allow us to perform the desired improvements more easily while decreasing the risk of introducing bugs and without having to scale up our server infrastructure.
soarV2 stays true to its roots: allowing the pilots to see, at a glance, where to fly cross-country. On a single screen, soarV2 shows, for each point of the map, the quality of thermals, and the wind speed and direction.
soarV2 is an open source software, and your contributions are welcome!
In soarV2, you can select the weather forecast model (GFS or WRF) and the zone to cover from the main menu at the top left of the screen. The next section compares soarV2 with soarGFS, and the next one compares soarV2 with soarWRF.
Differences between soarV2 and soarGFS
The main benefits of soarV2 compared to soarGFS are the following:
- soarV2 uses the model GFS with a resolution of 25 km versus 50 km for soarGFS, and the area covered by the forecast is much wider.
- soarV2 shows a forecast for 9 days versus 7 days for soarGFS.
- soarV2 computes the speed of thermals in m/s because this is what soaring pilots are used to, instead of showing the raw values of the sensible heat flux in W/m² like soarGFS does.
Default view
By default, the main view soarV2 is similar to the “aerological map” of soarGFS:
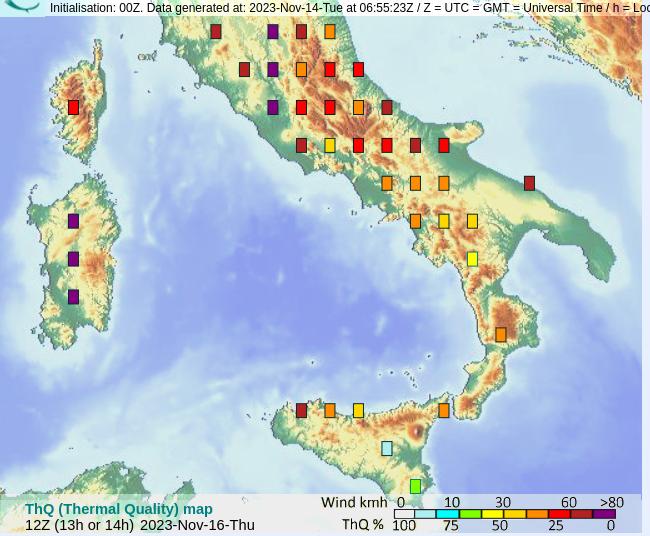
Aerological map in soarGFS.
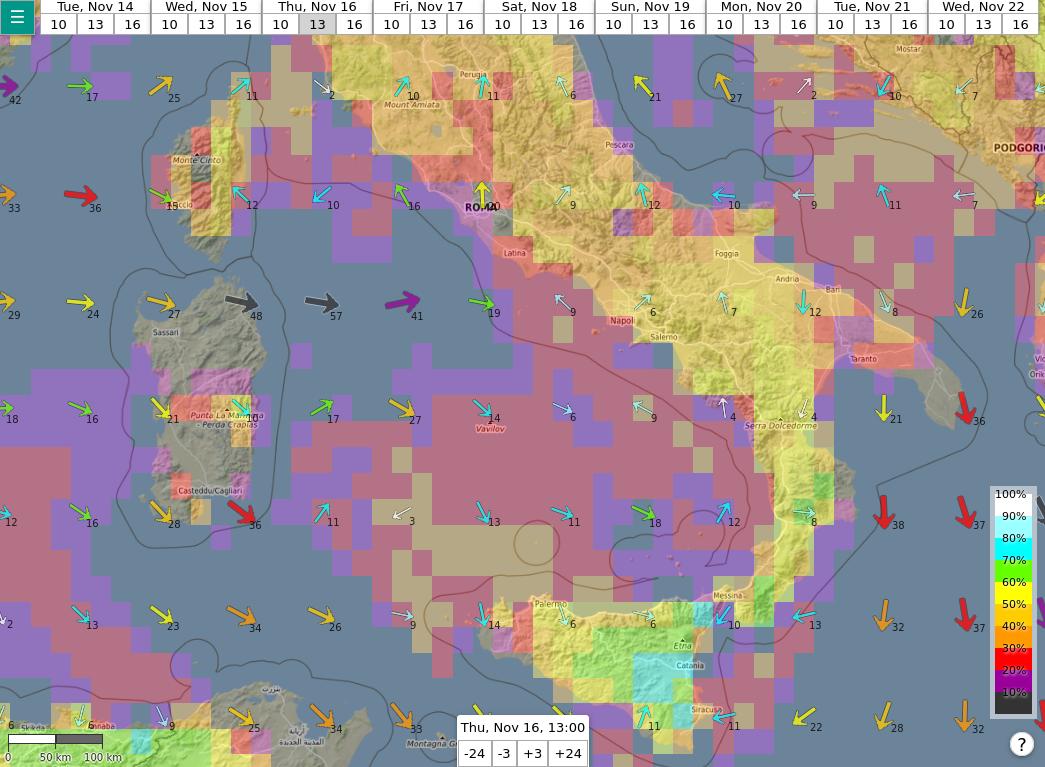
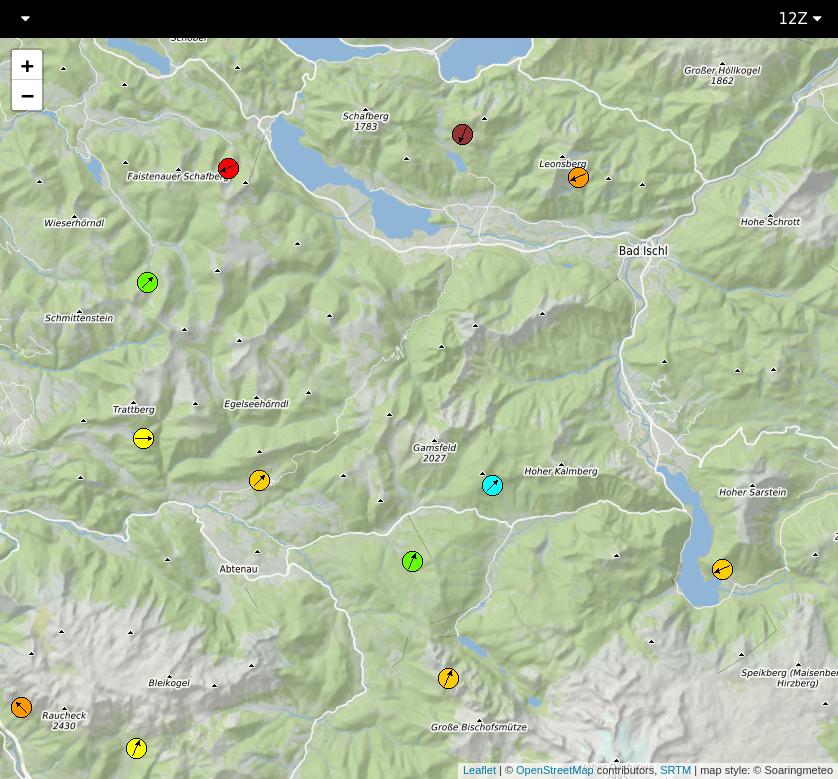
Default view in soarV2.
In both cases, the color of each point of the map shows the thermal soaring conditions (ThQ in soarGFS, XC flying potential in soarV2). The main differences are the following:
- The number of points in the map is significantly higher in soarV2. This is due to the fact that the underlying model has a resolution of about 25 km (instead of 50 km for soarGFS).
- The wind speed and direction are also shown by default on soarV2. You can hide the wind via the main menu (at the top left of the screen).
- The colors of the points are not always exactly the same between soarGFS and soarV2. This is because the computation for the thermal quality is slightly different in both tools.
- The time is displayed according to your local timezone in soarV2 whereas it is displayed according to the Coordinated Universal Time (UTC) in soarGFS.
Meteograms
In soarV2, when you click to a location on the map a box shows additional information as well as a button to display a meteogram for this location.
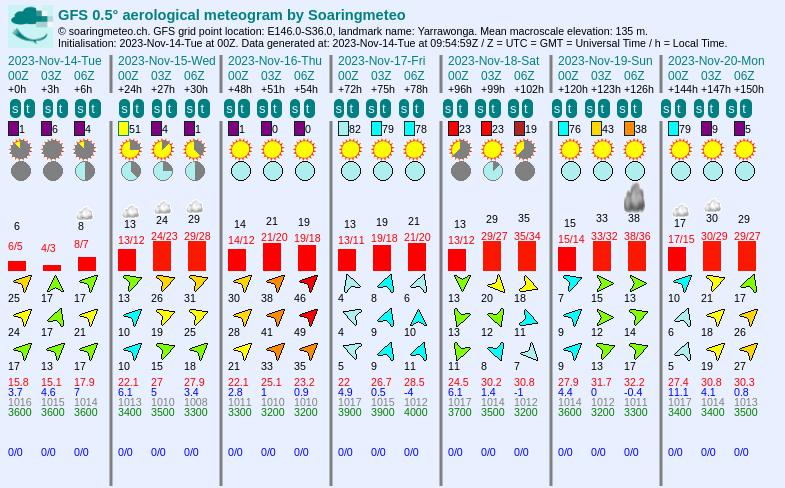
Meteogram in soarGFS.
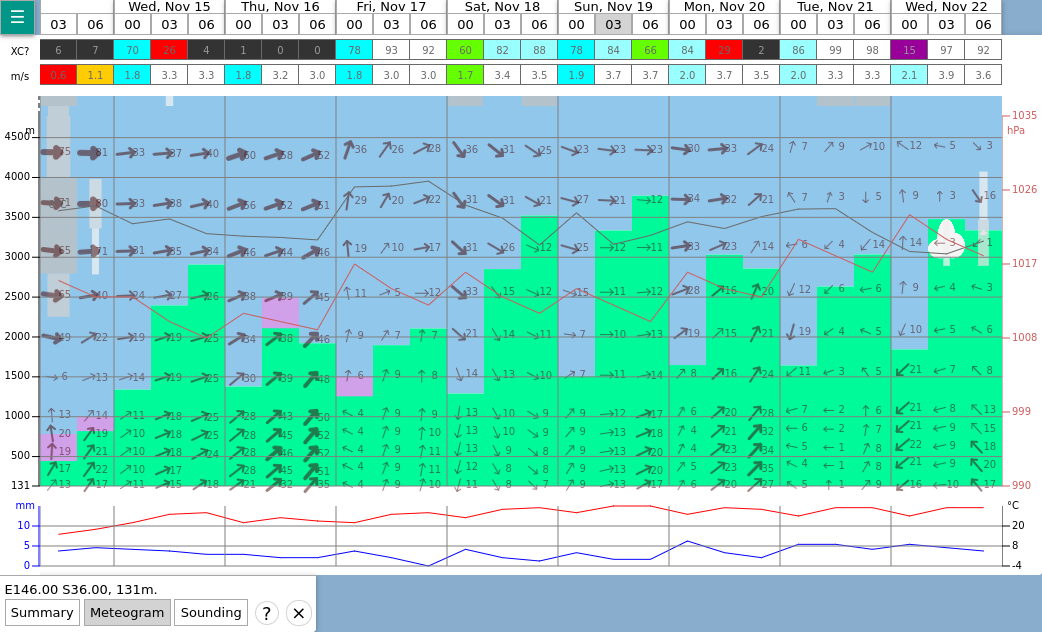
Meteogram in soarV2.
In both cases, the meteograms show the forecast for the next days at the selected location. Overall, both tools show similar information (thermal quality, cloud cover, boundary layer depth, wind speed and direction at various elevation levels, atmospheric pressure, rainfalls, etc.), but the layout is a bit different. The main differences are the following:
- The forecast covers 7 days in soarGFS whereas it covers 9 days in soarV2.
- In soarGFS, the cloud cover is shown by a pie chart indicating the total cloud cover, whereas soarV2 shows the cloud cover at various elevation levels with gray strips (the wider the strip, the more the cloud cover). The relative insolation is not shown in soarV2 because this data is too approximate.
- In soarGFS, we show the wind speed and direction at three elevation levels, whereas in soarV2 we show them at various elevation levels.
- In soarGFS, we show the altitude of the convective clouds base with a numerical value, whereas in soarV2 we show them graphically.
- In soarGFS, we provide numerical values for the isotherm 0°C and the atmospheric pressure, whereas in soarV2 we show them graphically (the black curve and the red curve, respectively).
- In soarGFS, we show the temperature of the ground and the dew point temperature with numerical values, whereas in soarV2 we show them in the bottom graph.
Sounding diagrams
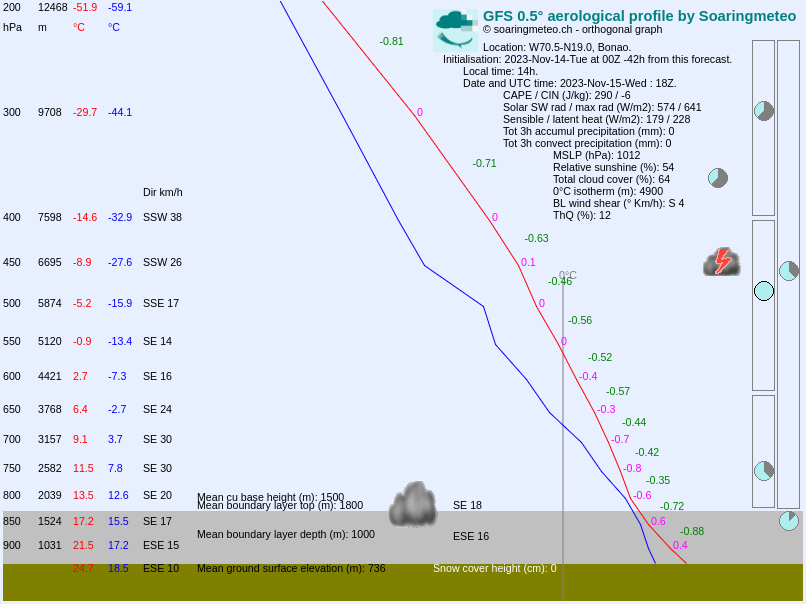
Sounding diagram in soarGFS.
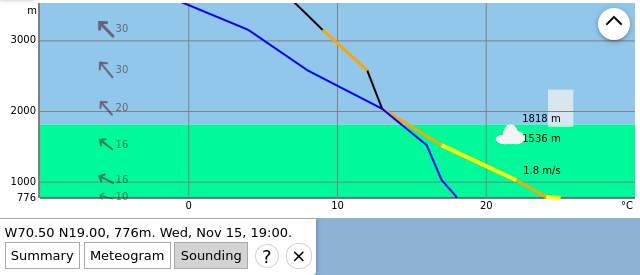
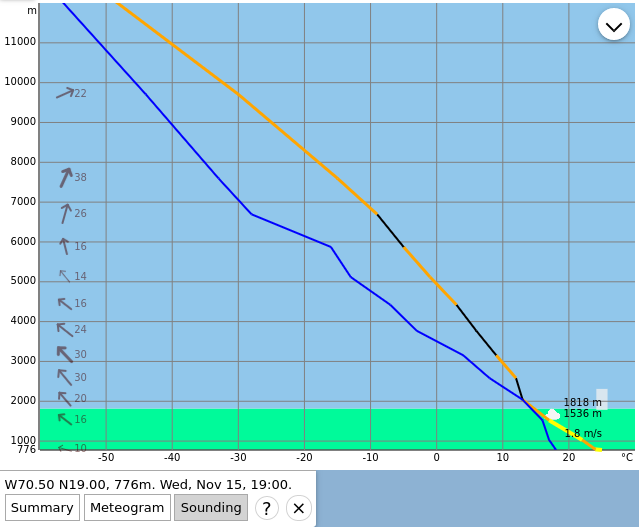
Sounding diagram in soarV2 (expanded diagram).
The main differences are the following:
- By default, soarV2 shows only the altitudes close to the boundary layer (up to 2500 m in the example), but it is possible to show the whole diagram by clicking to the top right button (here is the result).
- soarGFS provides numerical values for the lapse rate, whereas in soarV2 we use a color code to indicate whether the atmosphere is stable (black and purple) or instable (orange and yellow).
- soarV2 uses more points than soarGFS: it shows the wind at more elevation levels, and the air temperature curve is more detailed.
- In soarGFS we only provide a numerical value for the wind direction, whereas in soarV2 we show the wind direction with an arrow.
- In soarGFS, we show the cloud cover with pie charts at the following elevation levels: boundary layer, low-level clouds, middle-level clouds, high-level clouds, and total cloud cover. In soarV2, we show the cloud cover with the gray strips at the right of the diagram, at many elevation levels. The wider the strip, the more the cloud cover.
- Several variables (CAPE, CIN, irradiance, latent sensible heat, atmospheric pressure) are provided in soarGFS only.
Other differences
Here are some other differences between soarGFS and soarV2:
- There are no pressure difference diagrams in soarV2.
- There are no “text forecasts” in soarV2.
- The user interface is available only in English in soarV2.
Differences between soarWRF et soarV2
The main benefits of soarV2 compared to soarWRF are the following:
- soarV2 shows all the points of the domain computed by the WRF model (about 75,000 points), whereas soarWRF shows a subset only (about 1,800 points).
- soarV2 shows the wind direction and speed, at various elevation levels, whereas soarWRF shows only the wind direction, and only in the middle of the convective layer.
- soarV2 allows you to browse the results at every hour between 8:00 and 17:00 CEST, whereas soarWRF only provides three periods (11:00, 14:00, and 17:00).
- The meteograms of soarV2 show the cloud coverage at all the elevation levels, whereas soarWRF only shows convective clouds (cumulus).
Default view
The default view in soarV2 and soarWRF are similar:
Default view in soarWRF.
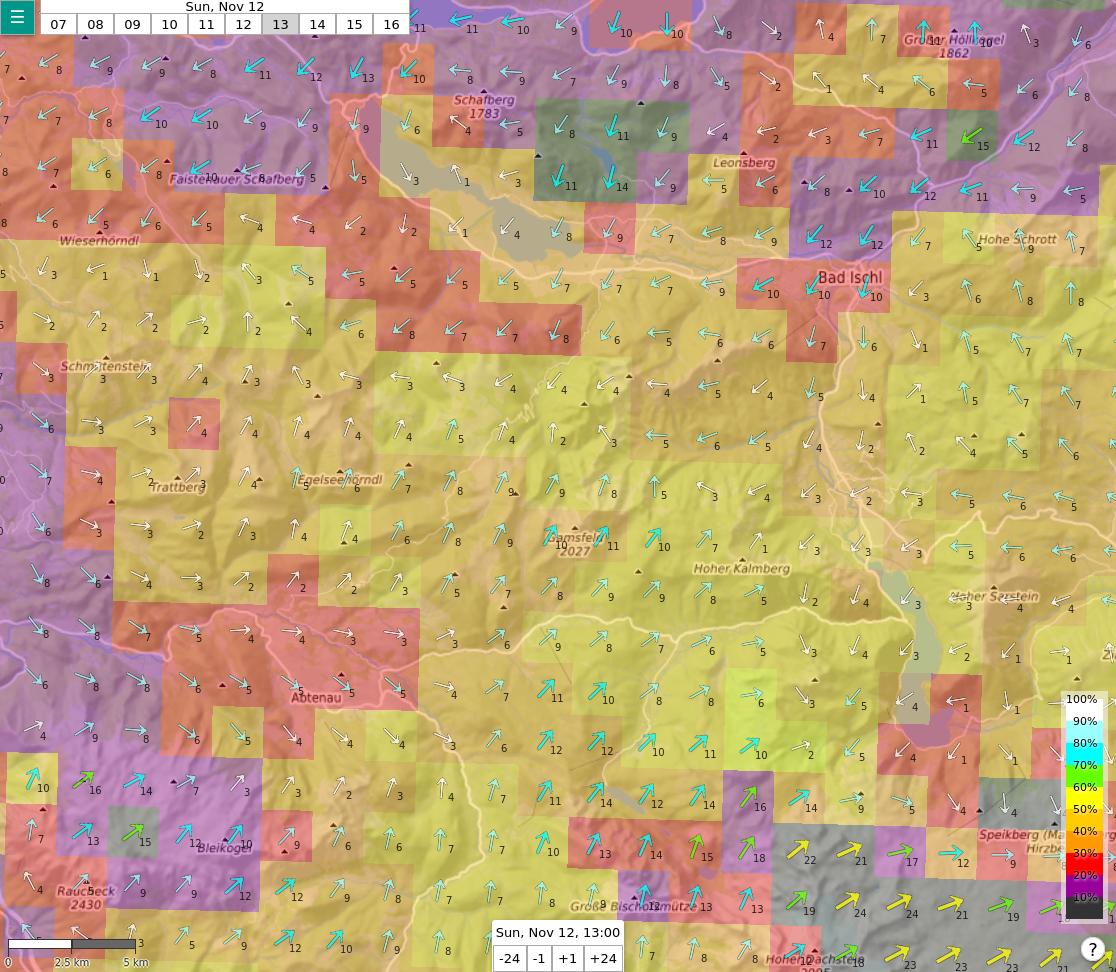
Default view in soarV2.
In both cases, the color of each point indicates the thermals quality (ThQ in soarWRF, XC flying potential in soarV2). The color of the points can vary between both tools because the formula is slightly different. The main differences between both tools are the following:
- The number of points is significantly higher in soarV2.
- soarV2 shows the wind speed (in km/h).
- soarV2 allows you to browse the forecast at every hour between 8:00 and 17:00 CEST, whereas soarWRF only provides three possible periods, 11:00, 14:00, and 17:00.
- By default, soarV2 shows the thermals quality, but it is also possible to display other types of information by using the main menu in the top left corner (soaring layer depth, thermals velocity, clouds and rain, wind on the ground and at various elevation levels).
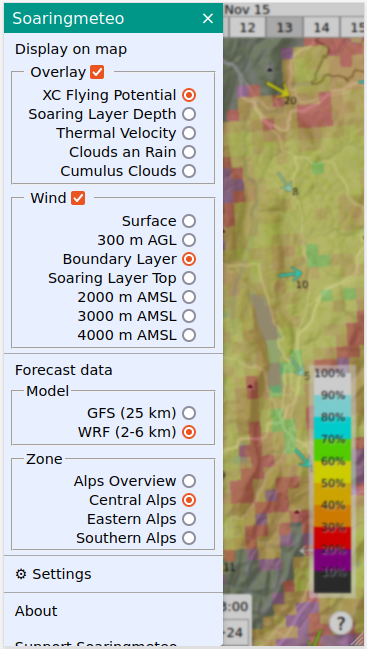
The main menu in soarV2 allows you to select the information to display on the map, and to switch to a different forecast model or geographical zone.
Meteograms
In soarV2, when you click to a location on the map a box shows additional information as well as a button to display a meteogram for this location.
Meteogram in soarGFS.
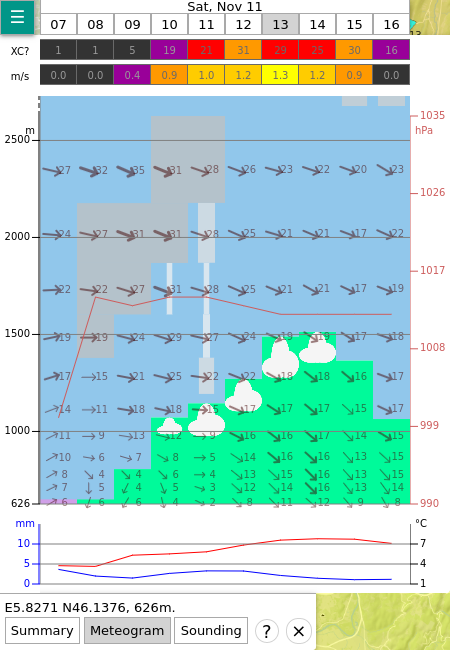
Meteogram in soarV2.
In both cases, the meteograms show the forecast at every hour of the day at the selected location. Overall, both tools show similar information (thermals velocity, boundary layer depth, wind speed and direction at various elevation levels, rainfall, etc.), but the layout is a bit different. The main differences are the following:
- soarV2 shows more details than soarWRF in elevation levels close to the boundary layer (in the example, at 13:00, soarV2 shows 8 data points within the boundary layer, whereas soarWRF shows 5 points).
- soarWRF only shows convective clouds (cumulus), whereas soarV2 also shows the cloud cover at various elevation levels (gray strips, the wider the strip, the higher the coverage).
Sounding diagrams
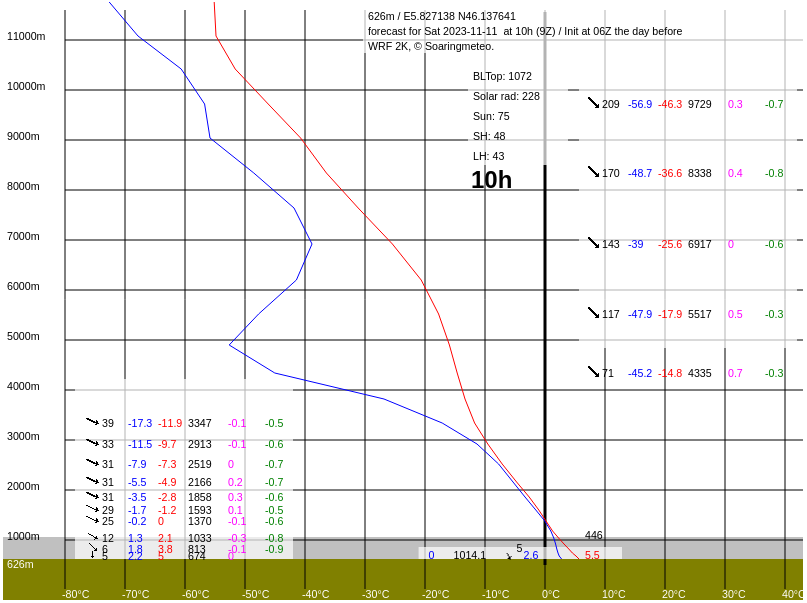
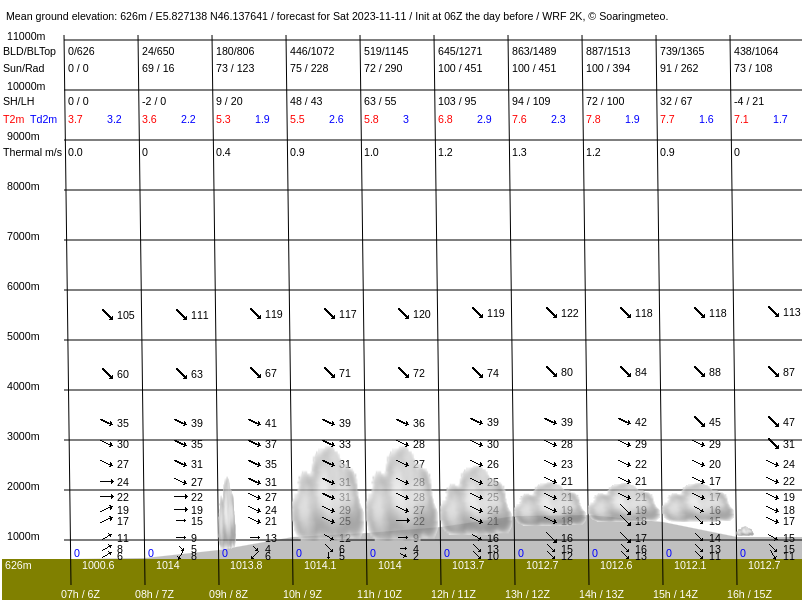
Sounding diagram in soarWRF.
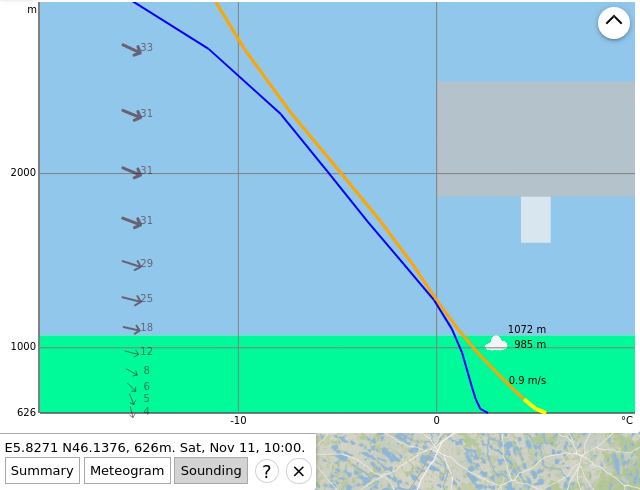
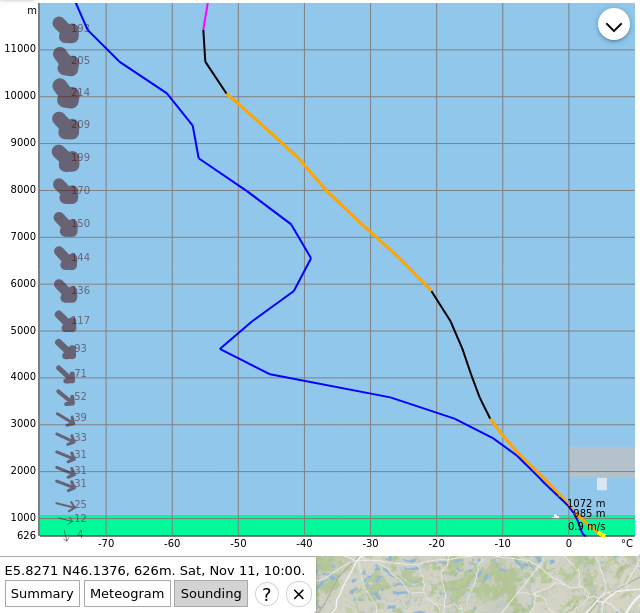
Sounding diagram in soarV2 (expanded diagram).
The main differences are the following:
- By default, soarV2 shows only the altitudes close to the boundary layer (almost up to 3000 m in the example), but it is possible to show the whole diagram by clicking to the top right button (here is the result).
- soarWRF provides numerical values for the lapse rate, whereas soarV2 uses a color code to indicate whether the atmosphere is stable (black and purple) or instable (orange and yellow).
- soarV2 uses more data points than soarWRF.
- soarV2 shows the cloud cover at various elevation levels (gray strips, the wider the strip, the higher the cloud coverage), as well as the height of the base of convective clouds (cumulus).
- Some information shown by soarWRF is not shown in soarV2 (sunshine, rainfall), or only visually (air and dew point temperature).
Copyright 2021, Soaringmeteo - All rights reserved. / The forecasts and the documents on this site are free for personal use but not commercial use nor their changing (including headers) before distribution or their intellectual ownership changing. / Visitors to this website use information at their own risk: the author of this site can not be held responsible for injuries or damages whatsoever due to information published on this site.